
Earlier this year, IMSA alumnus James Damore published “Google’s Ideological Echo Chamber,” a wildly contentious essay on gender differences. Damore’s Google memo ignited a nationwide conversation on gender disparities in STEM fields and why they exist. What happens when we apply this discussion to IMSA, our favorite math and science high school?
IMSA students are lucky to have a vast selection of classes to choose from. Take a look at how each course’s average male enrollment per semester compares to its average female enrollment. While Engineering, Modern Theater, Band, and required courses have nearly equal numbers of male and female students, many other courses have significant gender imbalances. Interestingly, every famously difficult STEM class is dominated by male students. Over the past 6 school years, there have been 2.5 boys for every girl in Modern Physics, Calculus-Based Physics, and Multivariable Calculus; 4 boys for every girl in Computational Science and Introduction to Algebraic Structures; and 10 boys for every girl in Theory of Analysis. Female-heavy STEM courses are either biology electives or classes like AB Calculus (2.5 girls for every boy) and Computational Thinking (1.8 girls for every boy), which are less rigorous and often taken by students less comfortable with math and computer science.
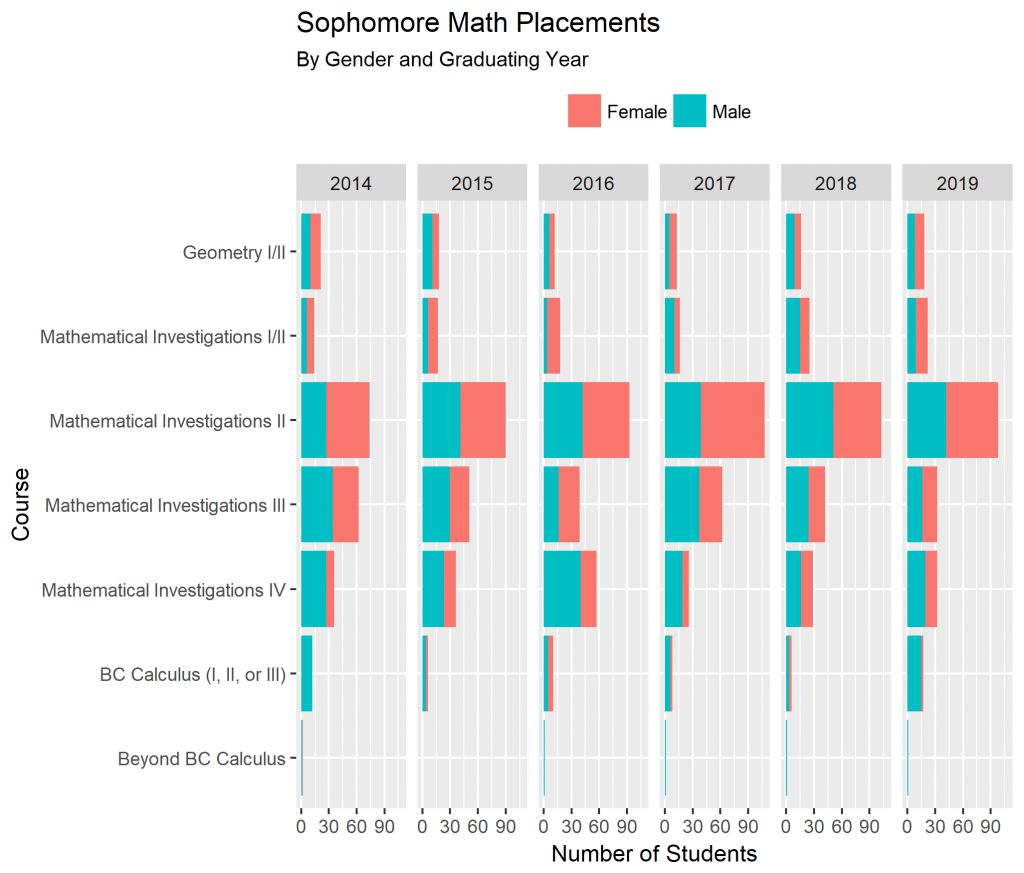
It may be tempting to conclude that IMSA deters girls from pursuing “male” fields like math, computer science, and physics, but that’s not necessarily true. Academic gender differences already exist in incoming sophomores; average male students arrive at IMSA stronger in STEM than their female counterparts. For one thing, boys place into higher-level initial math classes sophomore year: while 28% of boys test into MI 4 (Pre-Calculus) or higher, only 13% of girls do. Math placement distributions vary slightly from year to year, but the general trend is that lower-level math classes are female-heavy and higher-level ones are male heavy.
Average grade points earned in required sophomore courses suggest that boys do better in STEM while girls do better in humanities classes.
The most prominent disparity is in SI Physics, where 52% of male students earn A’s compared to only 35% of female students.
Mouse over points in the plot below to compare male and female students’ average performance in each class. Again, girls tend to do slightly better in most humanities classes, while the reverse is true for science classes. However, in some of the challenging, male-dominated STEM classes observed earlier, female students actually get the higher average grade, like in Introduction to Algebraic Structures I, BC Calculus II/III (an accelerated calculus course), and Computational Science.
Computational Science is an especially interesting case. It’s a notoriously challenging, 80% male class where male and female students earn A’s at similar rates. Compared to the female students, a higher percentage of male students earn both C’s and high A’s, suggesting that boys in Computational Science are more likely to either struggle greatly or excel greatly.
It’s easy to see that academic gender differences exist at IMSA, an institution that strives for diversity and equality. Understanding why they exist, though, is much harder. Is something in the culture here influencing and encouraging these disparities? Are they any more or less prevalent at IMSA in comparison to typical high schools? Do they simply follow from trends that exist in incoming male and female students?
If male students usually start in higher math classes and perform better in introductory science classes, it makes sense that advanced math and physics courses are male-heavy. However, advanced biology and chemistry classes are female-heavy or gender-even despite boys doing better than girls in SI Chem and just as well as girls in SI Bio. Furthermore, AB Calculus is far more female-heavy than any pre-calculus math course, which means that more girls than boys who begin on track to take BC Calculus still elect not to.
Maybe the IMSA bubble doesn’t shield us from societal expectations for girls’ and boys’ interests. Maybe the question isn’t why certain students take difficult classes, but rather why certain classes are deemed difficult. Maybe the male and female IMSA applicant pools are already vastly different. Maybe the difference between male and female residential culture seeps into academics. Maybe loud, bold, and risk-taking students are mostly male, and teachers inadvertently respond to them in a way that further discourages female participation. Most likely, the academic gender disparities result from some chaotic snarl of all these things and more. In any case, investigating these differences through data is only a starting point. It’s our job to continue exploring if they result from inequity at IMSA, and if so, what we can do to address them.
Notes –
- Special thanks to Dr. Christy Rollinson, Dr. Steve Condie, Mr. Steve Crittenden, and Dr. Leah Kind for their helpful insights and perspectives.
- This article uses 50,000 data points on all transcript entries recorded from Fall 2011 to Spring 2017. The data was obtained via FOIA request in June 2017.
- Students’ genders represented in the data visualizations are given as they are stored in official school records.
- Students who leave IMSA early on in the semester don’t get semester grades and aren’t included in this data. That’s why classes required for all incoming students (e.g. Literary Explorations) do not have a perfect 1:1 gender ratio, even though IMSA tries to admit equal numbers of male and female students.
- Sometimes, sophomore students are allowed to test out of introductory science courses and take other electives instead. These students are represented by enrollments in the data where sophomores take upperclassmen chemistry, physics, or biology classes. There were 210 of these data points, 74 female and 136 male.
- GPA (Grade Point Average) was calculated by translating A and A- to 4; B+, B, or B- to 3; C+, C, or C- to 2; and D to 1. The grade points were averaged to find the GPA for a group of grades or for a class.
- Some more fun facts regarding math placements: The Class of ’19 had an abnormal number of students who tested into BC Calculus. Class of ’16 had a jump in students testing into MI IV. And Class of ’18, the current seniors, had surprisingly gender-even math placements. Of the students who started in MI IV or beyond, 44% were female, compared to 20%, 36%, 32%, 26%, and 30% for the Classes of ’14, ’15, ’16, ’17, and ’19, respectively.


This is great! It’s a sensitive topic and you have handled it well, Lucy.
Something else of note would be the acceptance rate of females compared the acceptance rates of males to IMSA. Last I checked, a higher percentage of females are accepted to IMSA in order to better balance the gender scales. At least for the Class of 2017.
You lightly tapped on applicant pools in your closing remarks but there’s some additional data that’s available on this here – https://www.imsa.edu/sites/default/files/upload/admissions_class_of_2017_presentation_0.pdf
More males than females applied to IMSA yet more female were accepted. More inferences could be drawn if we had information regarding the average SAT and GPA of incoming students by gender as well. Running a thought-experiment and making the assumption that both gender SAT/GPA histograms have the same spread and standard deviation, the average incoming male student would have a higher GPA and SAT score (assuming that the top performers were chosen) than the average incoming female student. Granted, this all hypothetical and even then only applying to the class of 2017.
Regardless, excellent work Lucy!
Excellent and fascinating article Lucy! Good work!
Very informative. Thank you!