What The R? An Introduction to Statistical Programming
Written By: Jeev Hora
R You Ready?
Programming Languages, much like tools in a toolbox, can have different uses for different scenarios. Just like how a carpenter would use a hammer for a nail but not a screw, a web designer would usually use Javascript for front-end, but not always back-end, development. Similarly,K Statisticians and data analysts use R for quickly generating, analyzing, and visualizing data.
The *R*ise of R
R was created by 2 professors, Ross Ihaka and Robert Gentleman, from the University of Auckland as an updated version of the 1970s language S. S was made for a similar purpose to R–to help the statisticians at Bell laboratories collect and investigate data–but it was becoming woefully slow and outdated. R’s original intended purpose was for an introductory statistics course at the university, but it eventually became popular enough on its own. R was maintained by the R project, and is now a free and open-source programming language maintained by programmers around the world.

 Figure 1
Robert Gentleman and Ross Ihaka.
Sources: ScorpionX and Wikimedia Foundation.
R is a dynamic, object-oriented, functional programming language. Dynamic programming means that many of the properties of the script, including the variable types, are only executed when the code is running; therefore, dynamic programming makes code simpler and more efficient to use. Object-oriented programming languages run code through objects which can store data/fields and procedures. Functional programming is very similar, but it uses the creation and composition of certain functions to create, store, and run data. All these attributes make R an extremely versatile language that can be picked up by anyone, with a little bit of patience.
Getting StaRted
R and Rstudio (the Integrated Development Environment that R runs on) can be installed on https://cloud.r-project.org/ and https://posit.co/download/rstudio-desktop/. Rstudio is the most popular way to program R, but regular R and other IDEs can be used as well, with more work.
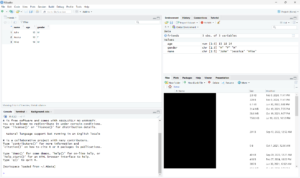
Figure 2
Layout of Rstudio
Source: Rstudio
The leftmost panel of the Rstudio interface features the actual code, the top right displays saved R and Python code, and the bottom right shows previously used files. As seen in Figure 2, Rstudio provides an ideal environment for all the coding and stats to happen!
Coding in R-anese
Simple arithmetic can be done using variables. Variables can be assigned to strings or lists:
> a <- 5
> b <-6
> sum(a,b)
[1] 11
It’s easy to make charts (also known as data frames) in R utilizing the data.frame command with multiple variables:
>name <- c(“John”,”Jessica”,”Mike”)
> age <-c(15,18,14)
> gender<-c(“M”,”F”,”M”)
> friends <- data.frame(name, age, gender)
> friends$name
[1] “John” “Jessica” “Mike”
T-tests and Chi-square tests are also commonly performed and simple to implement in R. This code shows an example:
t.test(a, b,
alternative = c(“two.sided”, “less”, “greater”),
mu = 0, paired = FALSE, var.equal = FALSE,
conf.level = 0.95, …)
While this code may initially seem overwhelming, it’s not much different from the statistics one may learn in a class such asMSI, just now in code form!
Installing Packages
R features many modules, libraries, and packages to add new functionality and quickly perform commands. Some of these important packages include Tidyverse, and more specifically, tibble and ggplot2.Tidyverse is a collection of packages for R, making it easier to create functions and plots. These utilities are found at tidyverse.org and can be applied by using the install.packages(“[package]”) command to install the package, and then loading the package by using install.packages(“[package]”). Tibble allows for more freedom with data frames, allowing the customization of names and other useful features. Ggplot2 is a data visualization tool. For example, if we had a large data frame named mpg, we could use ggplot2 to plot the data using this code:
>ggplot(data = mpg) +
>geom_point(mapping = aes(x = displ, y = hwy))
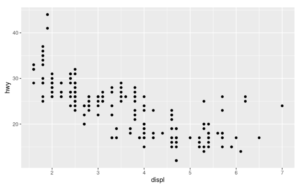
Figure 3
Effect of ggplot2 data
Source: R For Data Science, by Wickham & Grolemund
Together, Tidyverse, ggplot2, and tibble are important in optimizing the R user experience.
R is Supe*R* Useful!
R is used in multiple industries and by thousands of companies all over the world. According to a paper by Dhanda et al., R has an invaluable role in the scientific field, especially considering data science and biocomputing. Furthermore, R also has new packages being updated and released every day, making it advantageous to use. For example, one team of researchers built a predictive bio-growth package for R that has now been incorporated in other papers.
R is also having massive growth in analyzing and improving neural networks and machine learning algorithms. Certain packages like caret, randomForest, and e1071 have facilitated such growth.
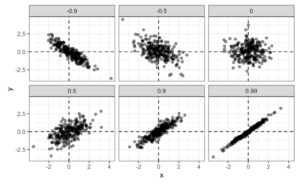
Figure 4
Linear regressions of age and height, plotted using R. This is one major use of R.
Source: Rstudio
Conclusion
While R already has important uses in traditional statistics, it is currently gaining popularity in many other fields such as data analytics, epidemiology, computational biology, and machine learning. Anyone can utilize R, from someone with less than CSI experience to a Ph.D. professor in Mathematics and Statistics. Many of the teachers at IMSA have even used R for their Master’s Thesis! So if you’re ever saying to yourself, “What the R?”, just keep calm and R on!
References
Giorgi, F. M., Ceraolo, C., & Mercatelli, D. (2022). The R Language: An Engine for Bioinformatics and Data Science. Life, 12(5), 648. https://doi.org/10.3390/life12050648
Morandat, F., Hill, B., Osvald, L., & Vitek, J. (2012). Evaluating the Design of the R Language. ECOOP 2012 – Object-Oriented Programming, 7313, 104–131. https://doi.org/10.1007/978-3-642-31057-7_6
Wikipedia. https://en.wikipedia.org/wiki/Ross_Ihaka#/media/File:Ross_Ihaka_(5189180796).jpg
.jpg)
Shepperd, M. (2023). CS5702 Modern Data Book. In bookdown.org. Bookdown. https://bookdown.org/martin_shepperd/ModernDataBook/
The R Foundation. (2019). What is R? R-Project.org. https://www.r-project.org/about.html
Wickham, H., & Grolemund, G. (2017). R for data science : import, tidy, transform, visualize, and model data. O’reilly. https://r4ds.had.co.nz/index.html.