As IMSA prepares to send off the class of 2023 and welcome the class of 2026, it is worthwhile to look back at who all has attended IMSA since the school first opened its doors to students in 1986. In some areas, such as sex assigned at birth, student proportions have remained relatively constant: IMSA only has so many beds for each assigned sex, after all. In other areas, however, they are more variable. According to Illinois state law, IMSA is required to “establish eligibility criteria which ensures ‘adequate geographic, sexual and ethnic representation,'” with the “ultimate goal of the selection process” being “to have admissions which approximate the demographics of the State.” But in practice, “admissions reflect the diversity of the applicant pool,” so racial statistics, for example, have varied drastically since the class of ’89 was admitted. In still other areas, such as self-identified gender and sexuality, it is more difficult to gauge IMSA’s diversity; the Diversity Climate Surveys, the best indicator of these parameters, only date back to 2016.
With that said, here is a breakdown of IMSA’s publicly-available diversity data:
Assigned Sex, Grade, and Race
Unless otherwise noted, data are from class admissions presentations given to the board of trustees and published on BoardDocs. Class of 2023 data can be found here, 2024 here, and 2025 here.
Enrollment by Sex Assigned at Birth
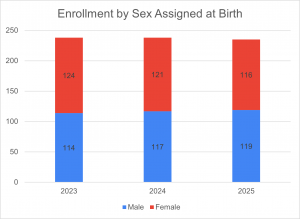
Student enrollment by sex assigned at birth
As it has been historically, IMSA’s initial enrollment for the classes of ’23-’25 by sex assigned at birth was split roughly 50-50, varying depending on the number of returning students of each assigned sex who dropped by the time of the next class’ enrollment period.
As Lucy Liu (’18) illustrated in a 2017 Acronym article, however, equal enrollment at the admissions level does not necessarily equate to equal representation in each classroom. IMSA Grades shows how certain classes—particularly the notoriously difficult, high-level math and science classes, such as Computational Science, Modern Physics, and Theory of Analysis—have significant disparities in enrollment by assigned sex. (In 2017, for example, 20 people assigned male at birth, but only 10 assigned female, took Computational Science).
Enrollment by Grade at Time of Application
The class of 2025 is the class of the shmen (or, would-be freshmen admitted to IMSA as sophomores). Whereas the classes of 2023 and 2024 initially had six and four shmen, respectively, the class of 2025 had 23.
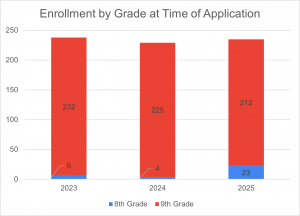
Student enrollment by grade at time of application. Includes six students from the class of 2023 and four from the class of 2024 who returned to IMSA as second-year sophomores
While it is quite possible that eighth graders are getting smarter, the increase in shmen also reflects a decrease in applications and a rise in the number of admitted students who turn down their offers from IMSA. In a July 2022 memo to the IMSA president, it is stated that applications for the class of 2025 were down by 50. The wait pool was also smaller (58, as opposed to an average of 80 over the past five years). While the number of students who declined their offer was not disclosed, the memo says that after the waitlist was exhausted, five beds were still unfilled, suggesting that 63 students opted to stay at their home schools (on average, over the course of the past five years, 40 students have turned IMSA down per year).
To fill the already-vacant beds—as well as those expected to empty as students changed their minds about coming to IMSA at the last minute—IMSA turned to deferred 8th-grade applicants: “Given we have exhausted the wait pool and there is capacity for five more female students, after consultation with Ms. Katie Berger and Dr. Comfort-Akwaji Anderson, we are in the process of inviting 8th grade deferred students to join the wait pool for the FY23 academic year.” In the future, the memo says, the Enrollment Management Team and Selection Committee will ensure that there is a larger wait pool and will also put an emphasis on admitted student engagement.
Another notable IMSA enrollment statistic in recent years has been the number of students returning as sophomores in the classes of ’23 and ’24. Because of the COVID-19 pandemic, certain students originally admitted to the class of ’23 (and, presumably, to the class of ’22, though this has not been confirmed) were given the opportunity to petition to return to IMSA as second-year sophomores, set to graduate in 2024.
Enrollment by Race
Considering Henry Wittich (’18)’s 2017 Acronym article (with much cooler graphs than mine; check them out here) and more recent data available on BoardDocs, IMSA has seen significant changes in student racial demographics since its establishment.
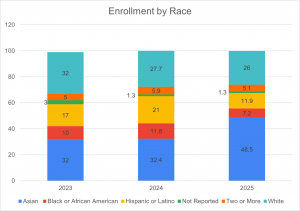
Student enrollment by race
To be clear, the data in this article for the classes of ’23-’25 (as graphed) pertain to enrollment and were obtained from BoardDocs, while Wittich’s graduation data were the product of a FOIA request (outdone once again). Still, even though memorandums (2019-20, 2020-21) suggest that the students who withdraw are not necessarily representative of the enrolled sophomore class, in both cases, <1% of students dropped (at the height of COVID-19, no less). For the sake of this article, enrolled sophomore and graduating senior demographics are considered to be similar.
Since IMSA time began, the school has been educating (net) larger numbers of Hispanic/Latine students (11.9% of the admitted class of ’25, down from 21% of the class of ’24, but up from 2.42% of the charter class of ’89). The number of Black/African American students at IMSA, on the other hand, has fluctuated within the 5-10% range, with 8.7% of the graduating class of ’89 identifying as such. Recently, the number of Black/African American students has been trending towards the bottom limit of that range, with Black/African American students making up an average of 5.3% of sophomore classes enrolling in 2023 and later.
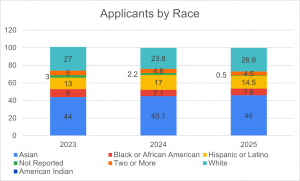
Applicants by race, for comparison
Other racial groups have numbers that are more difficult to track. American Indians/Alaska Natives accounted for 1.45% of the graduating class of ’89 but do not appear in classes of ’23-’25 enrollment charts, suggesting that none currently attend IMSA (excluding the possibility that they identify with two+ races or did not report their race). Students of two+ races, meanwhile, are not recorded as graduating in the class of ’89, while in recent years, they have constituted a highly variable percentage of the student body.
In terms of a racial majority, the graduating charter class of IMSA was 72.95% White and 14.49% Asian. Between 2005 and 2010, the gap in the percentages of graduating Asian and White people closed, and in recent years (with the exception of the class of 2025), the two groups have been similar in size.
Gender & Sexual Identity
The following data are from the Diversity, Equity, and Inclusion Office’s Diversity Climate Surveys, available on Digital Commons. Because the most recent surveys that are from 2018, 2019, and 2021, the data from these years are considered.
Gender Identity of Current Students
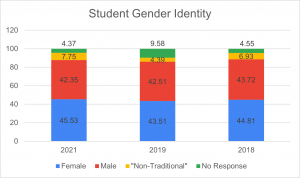
Current student gender identity
“Non-traditional” gender identities—which include transgender identities such as female-to-male and male-to-female transgender, non-binary, genderqueer/fluid, and two+ genders—hovered between 4% and 8% throughout the survey years. According to UCLA Law’s Williams Institute, 49,750 Illinois adults (or, roughly 0.40% of the state’s total population) identified as transgender in 2020. Even considering the potential increase in this percentage when transgender minors are taken into account (for example, the Williams Institute estimates that 1.4% of US youth identify as transgender, as opposed to only 0.5% of US adults), IMSA has a proportionately greater population of transgender people than the state.
Sexuality of Current Students

Sexuality of current students
As with gender identities, “non-traditional” sexualities are represented in greater numbers at IMSA than they are statewide, with between 26% and 34% of students identifying as non-heterosexual in 2018-19 and 2021. For comparison, the Williams Institute estimated that 390,000 Illinois adults (roughly 3.1% of the state’s total population) in 2020.

Be the first to comment on "IMSA by the Numbers"